Getting started with CancerSEA-X
CancerSEA is the first dedicated database designed to comprehensively decode distinct functional states of cancer cells at single-cell resolution. In this major update, CancerSEA-X has become the most comprehensive cell state database to date, offering systematic classification and characterization of 156 distinct cell states across malignant, immune, and stromal cells. Built upon 239 single-cell RNA sequencing (scRNA-seq) datasets spanning 32 cancer types, it provides a pan-cancer TME cell state atlas. The platform supports multiple data access modes, including interactive browsing, keyword search, and data download, enabling seamless exploration of cell state signatures and their functionally correlated genes.
- Cancer cell: 25 cell states
- Immune cell:
- CD8 T cell CD8 Tm cell: 20 cell states
- CD4 T cell CD4 Th cell CD4 Tm cell CD4 Treg cell: 32 cell states
- B cell Memory B cell: 19 cell states
- Dendritic cell: 15 cell states
- Macrophage: 16 cell states
- Monocyte: 3 cell states
- Stromal cell:
- Cancer-associated fibroblast: 12 cell states
- Endothelial cell: 14 cell states
Menu
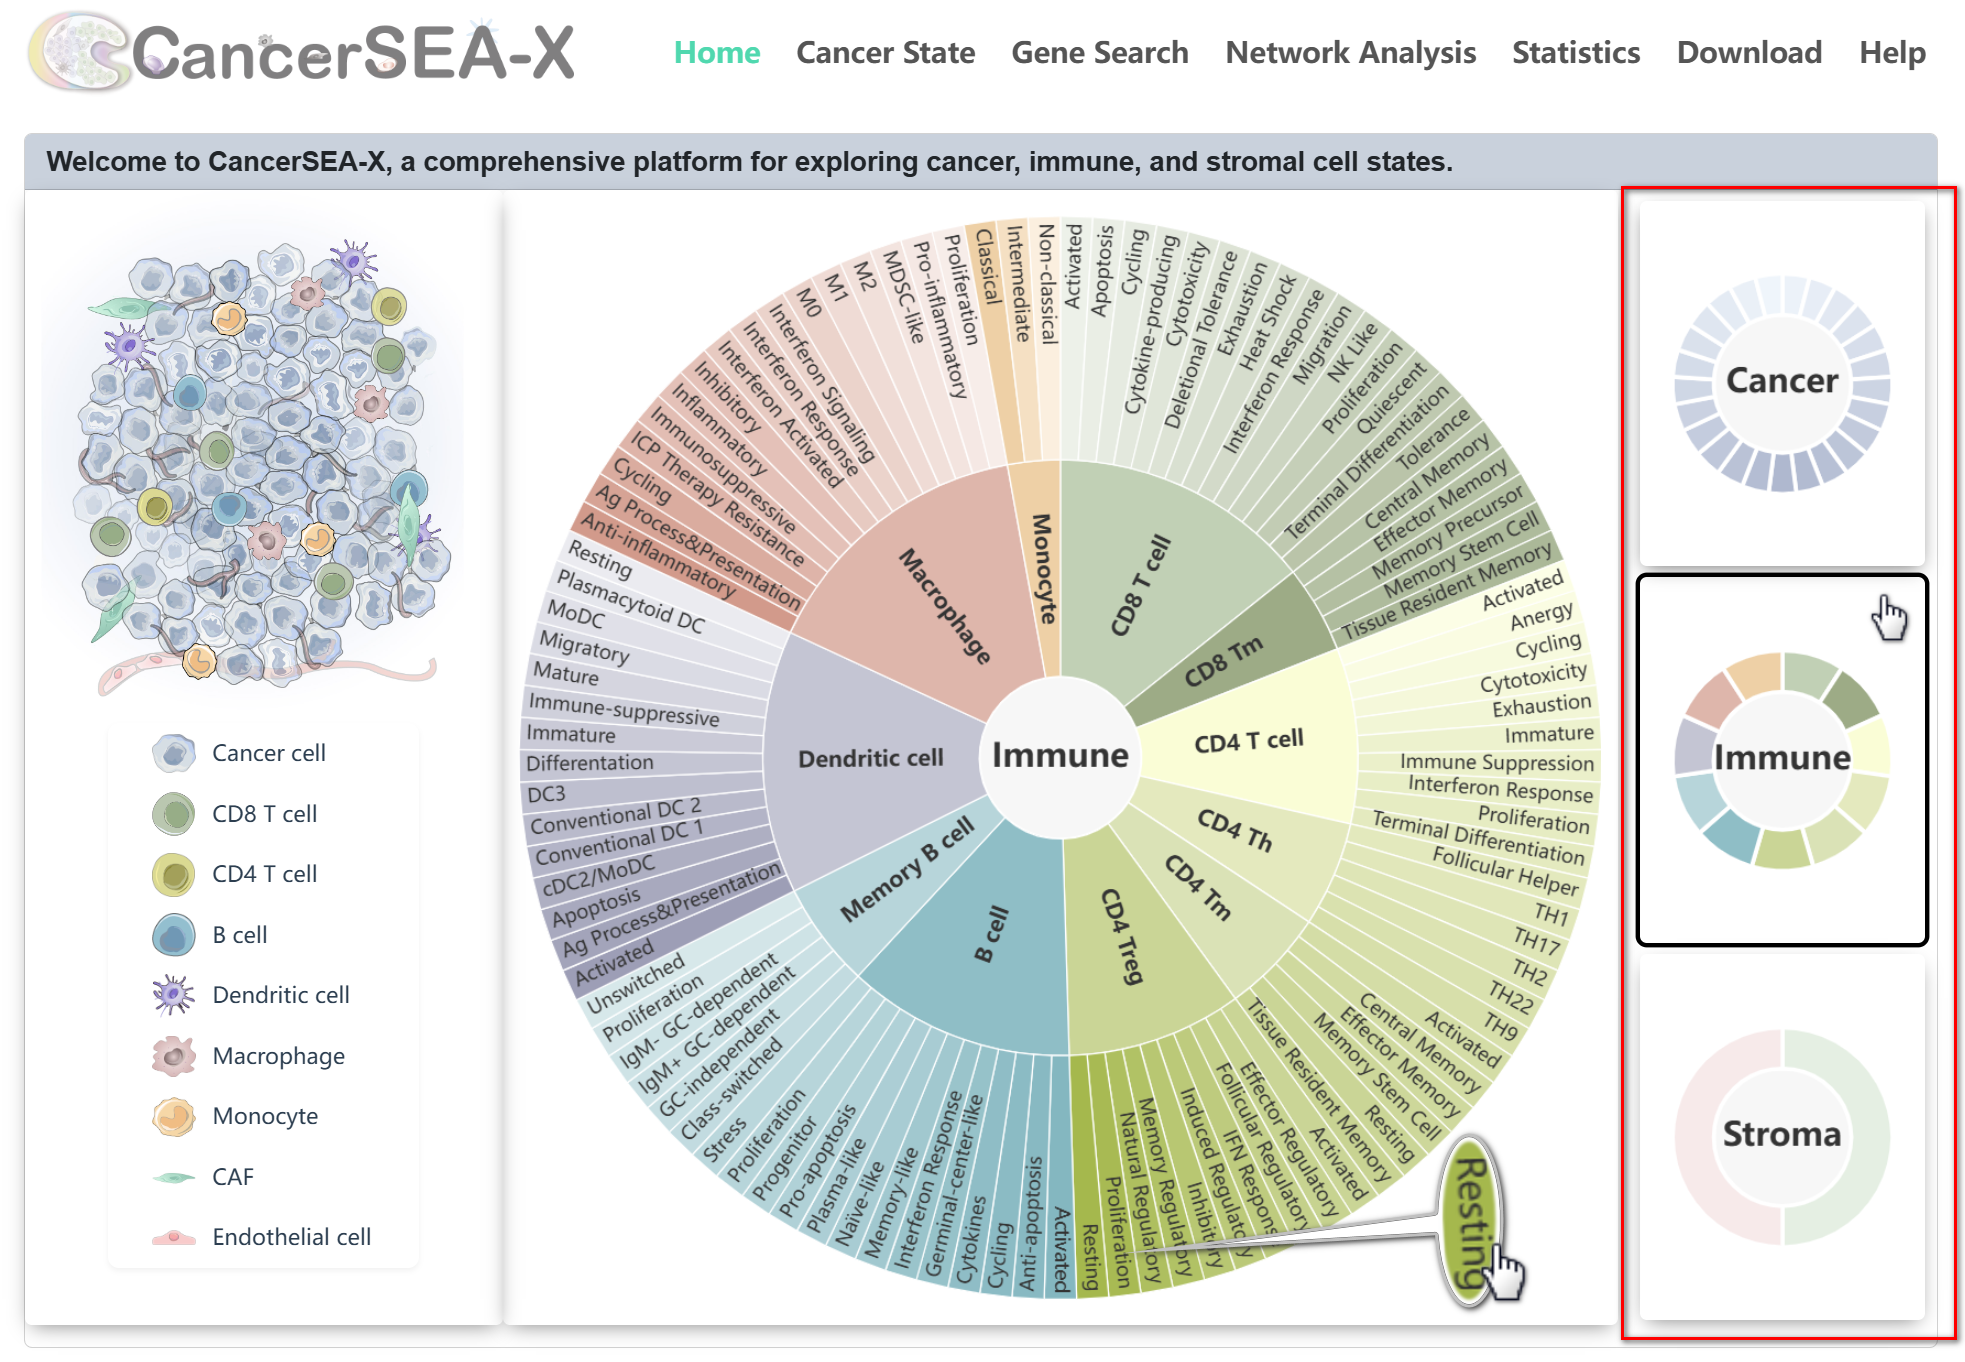
The home page displays all 156 cell states by category. Users can quickly browse cancer, immune, and stromal cell states by toggling the thumbnails on the right or clicking the cell types on the left. Clicking any cell state in the Sunburst Chart to jump to Cancer State page and start the exploration.
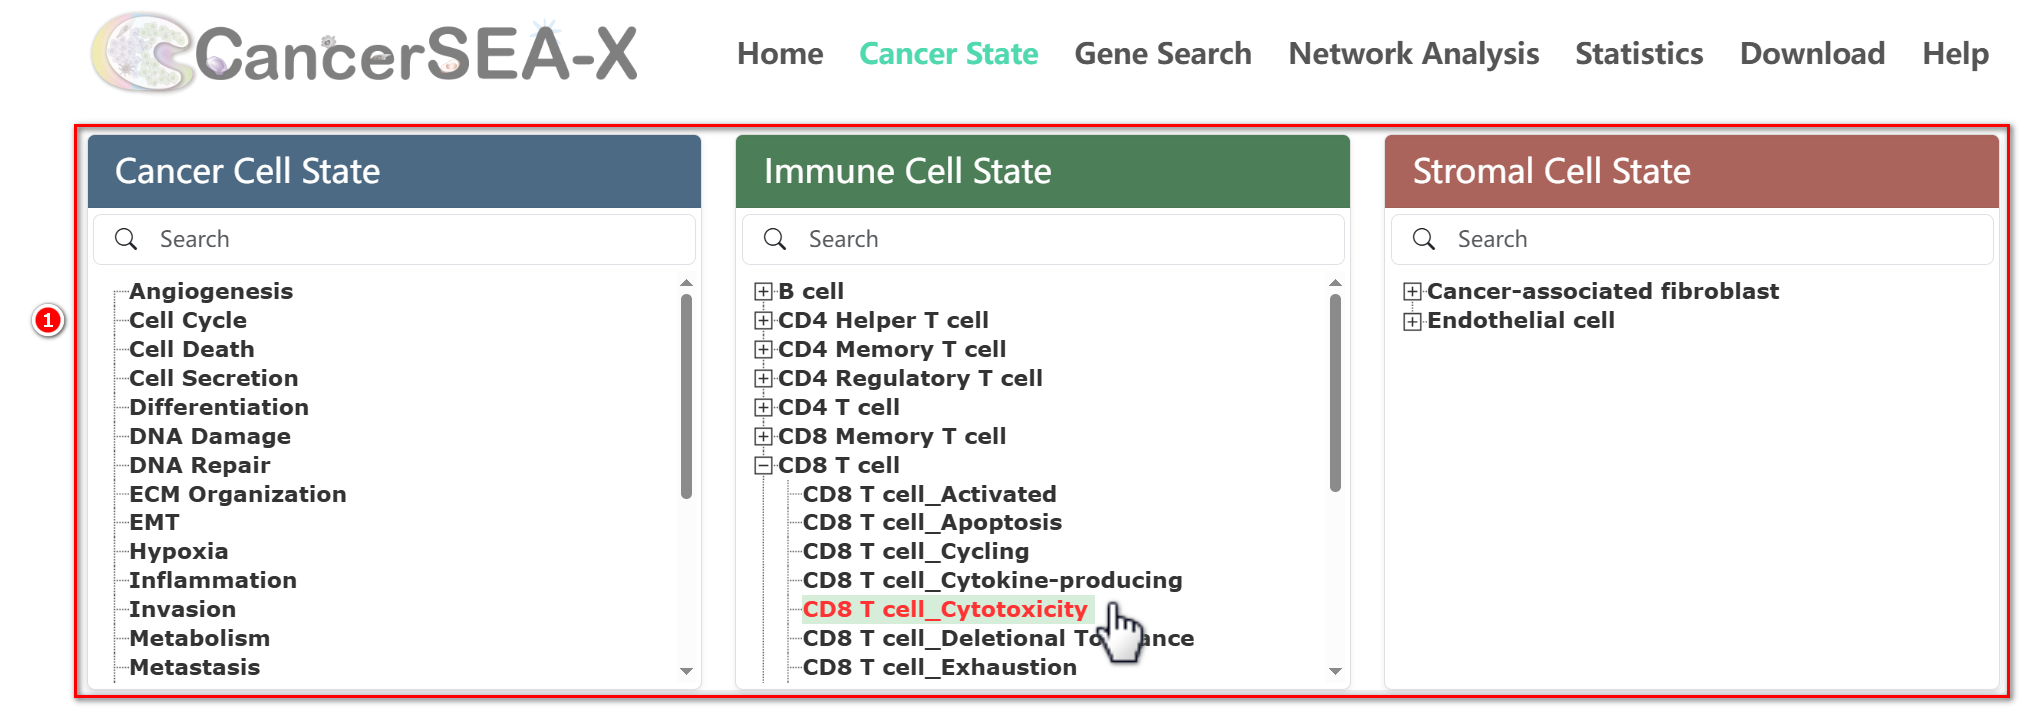
Cancer State Pages are divided into two sections: gene signature repository and cell state spectrum. Users can select or search a cell state from the three directories.
-
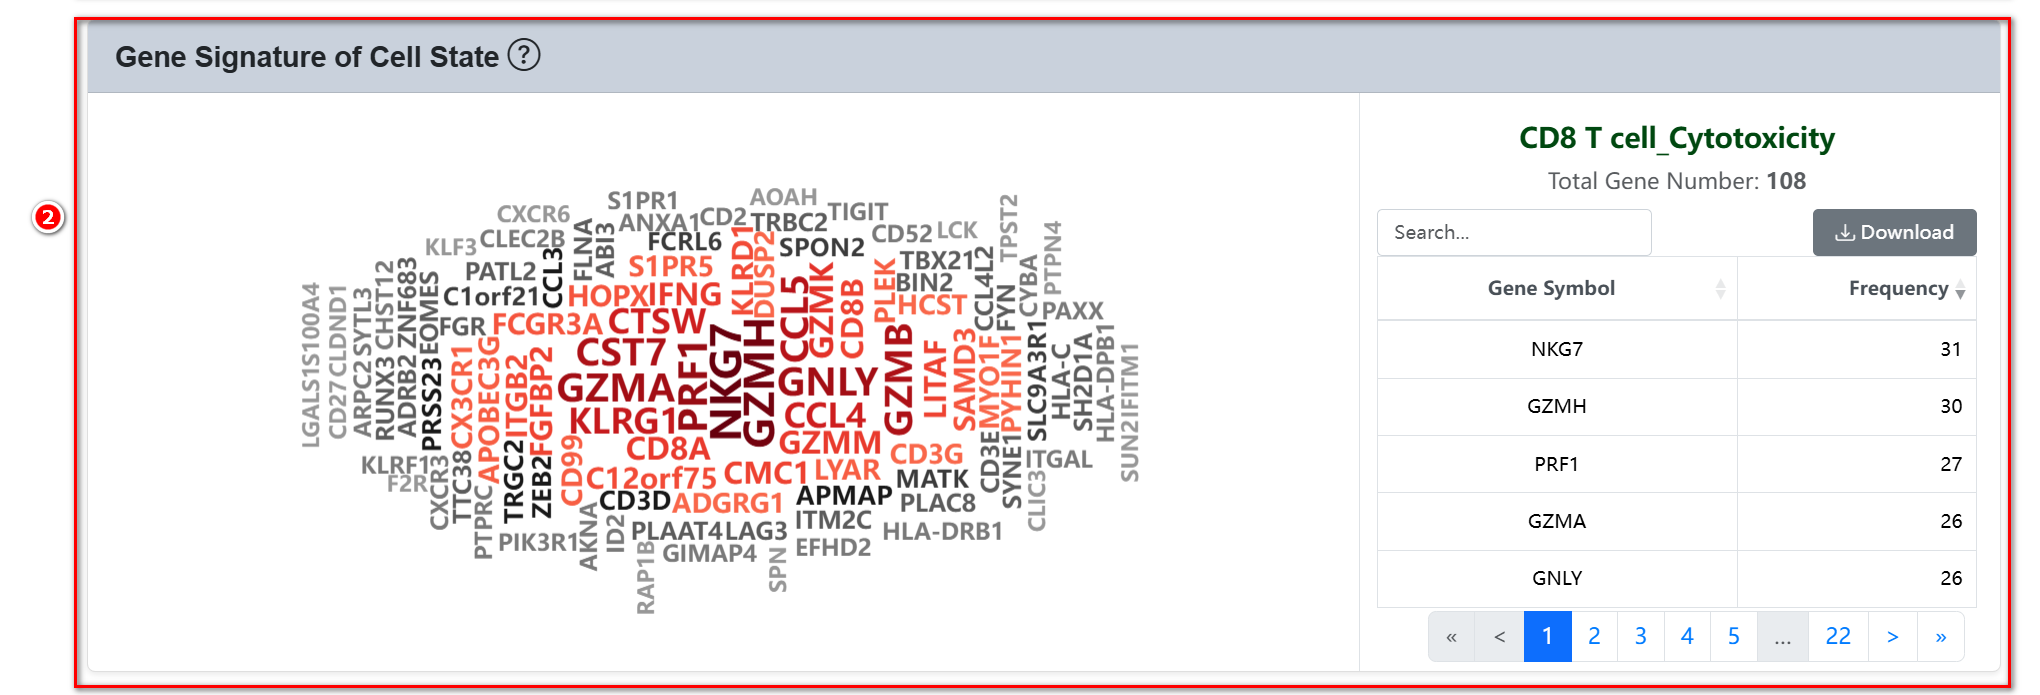
(1) Gene Signature Repository: A word cloud displays high-confidence
signature genes for the selected cell state, along with their frequency in relevant
literature we have collected. Users can click the Download button to export full
gene lists(.tsv).
-
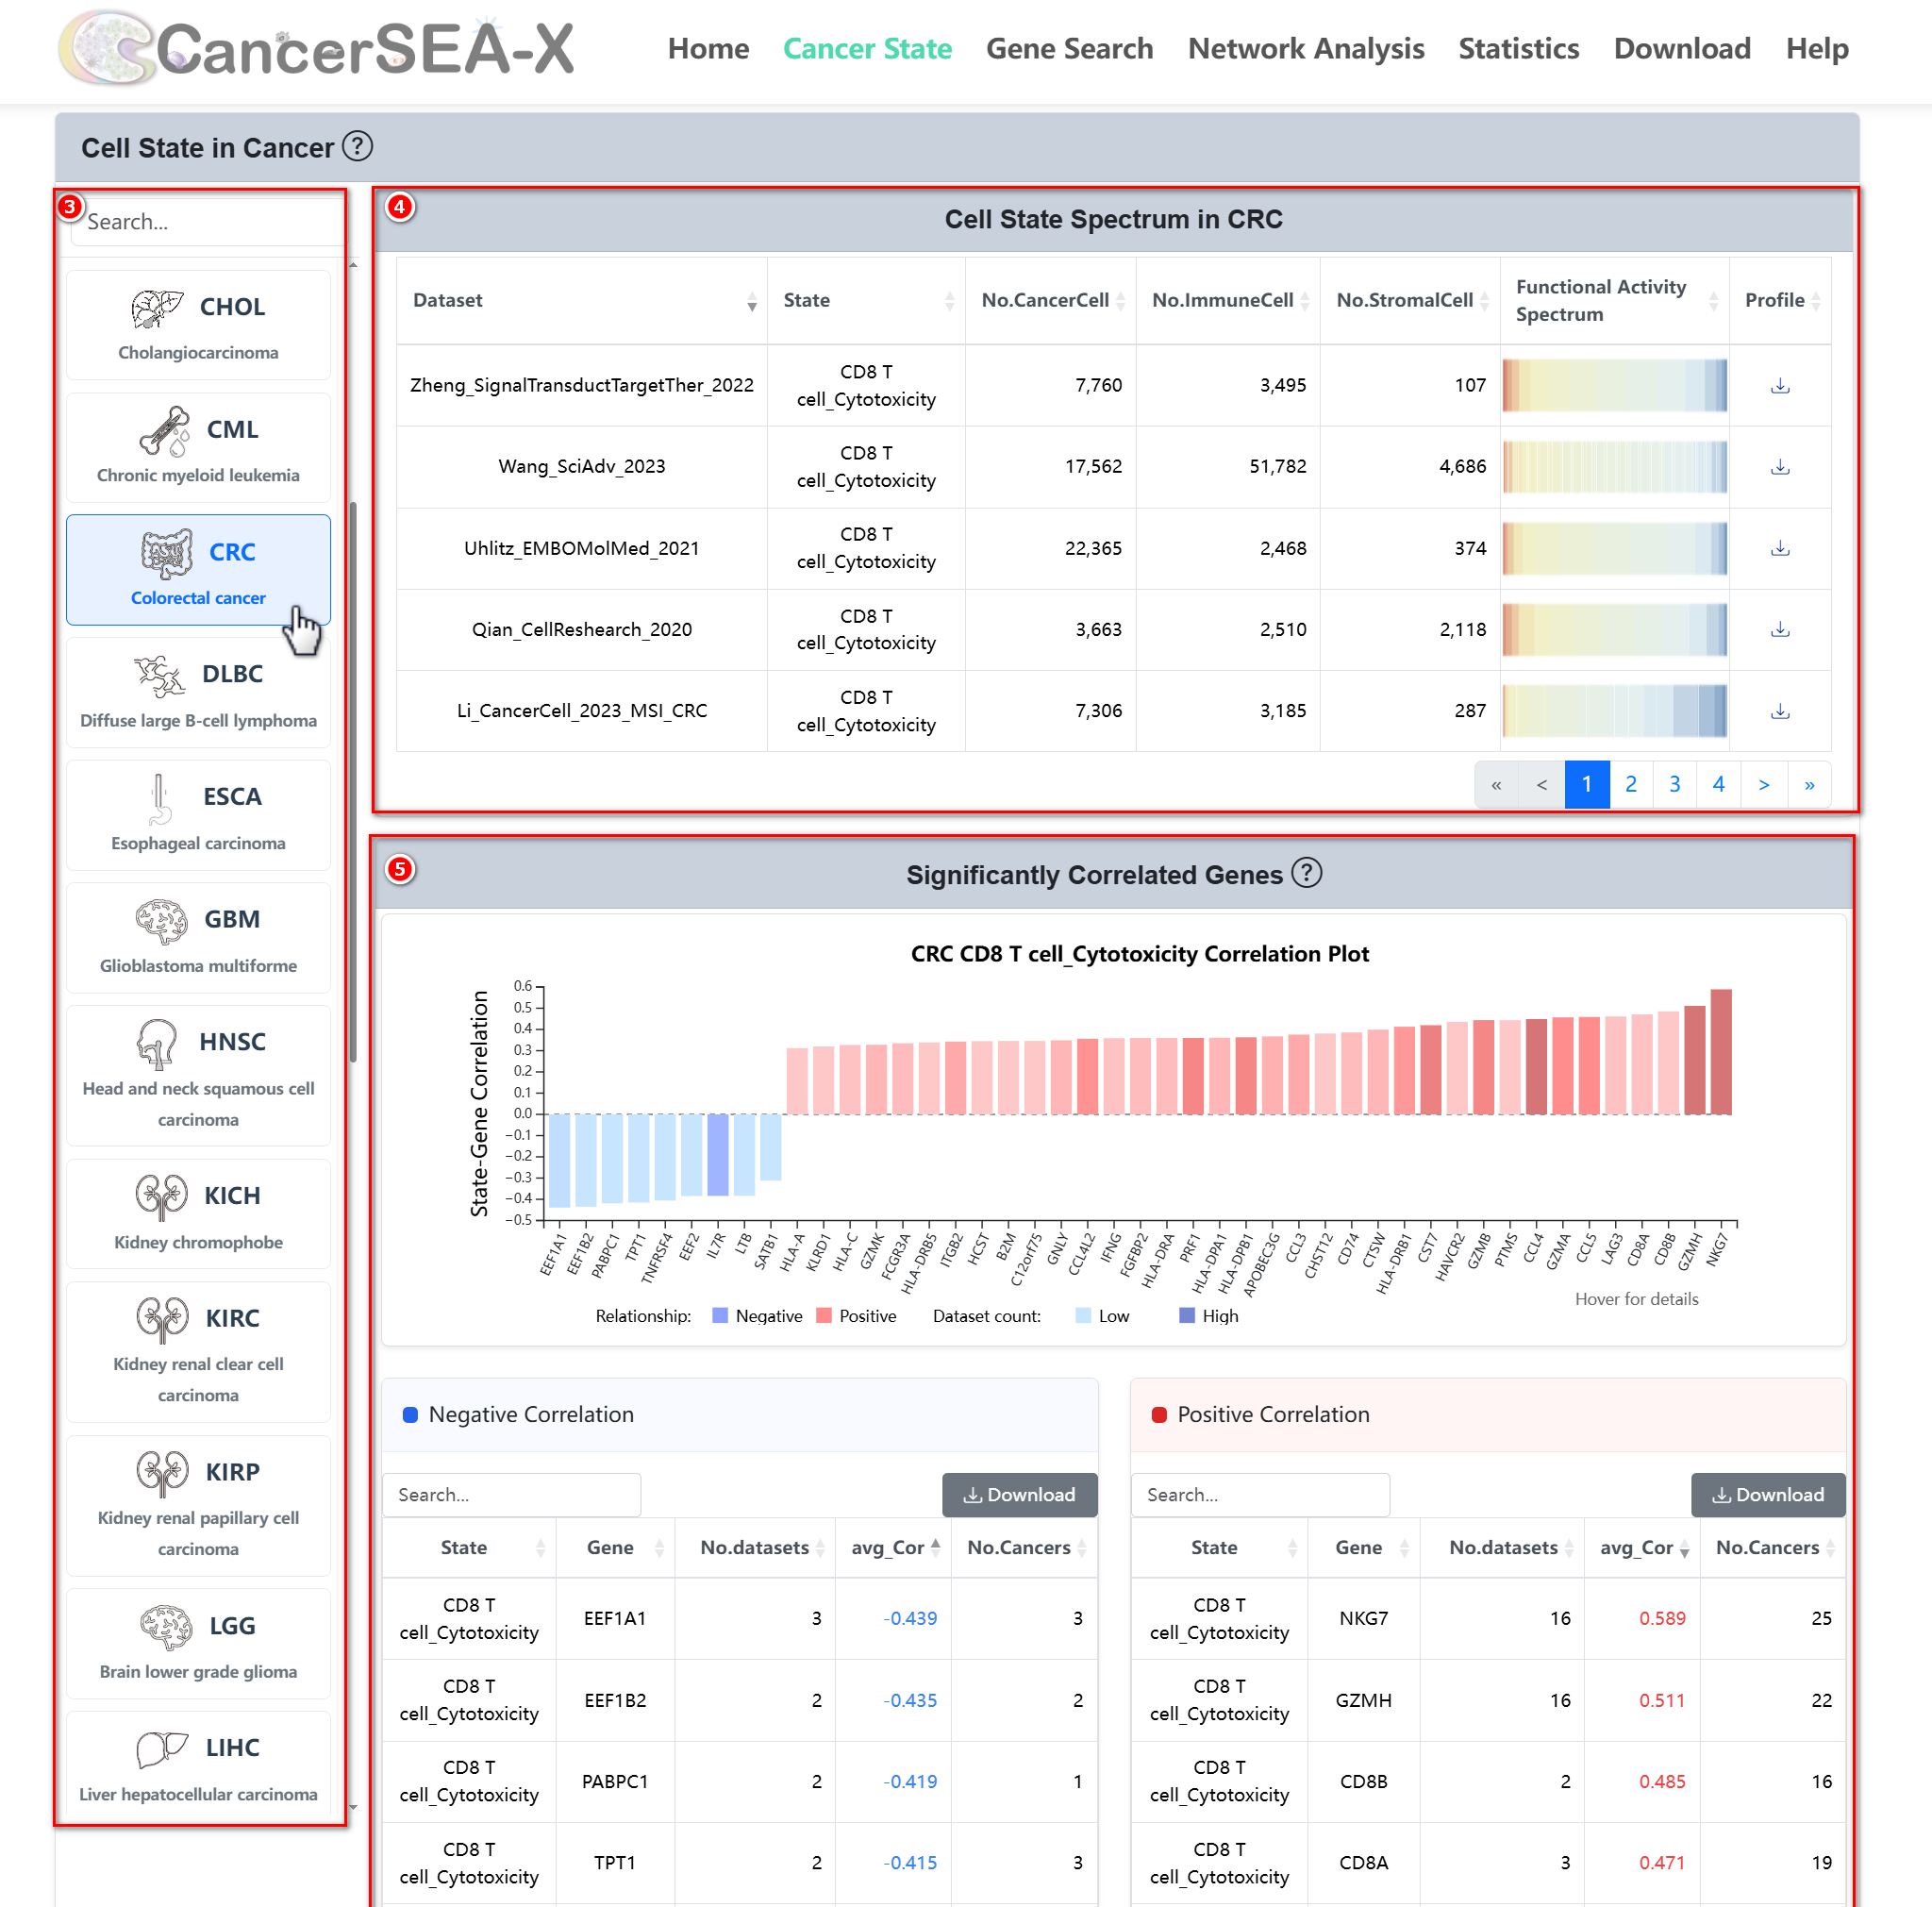
(2) Cell State Spectrum: This section shows the representation of the
selected cell state across 32 cancer types. For a specific cancer type, e.g. CRC:
- Cell State Spectrum: Users can explore the cell state functional activity spectrum across various CRC datasets through a heatmap (red for high scores, blue for low scores).
-
Significantly Correlated Genes: Users can explore genes correlated
with the selected cell state in CRC (Pearson |r| > 0.3, FDR < 0.05, by ≥
2datasets). A barplot displays these state-genes relationships, with
color intensity indicating the number of supporting datasets. The table
below provides concise details, including the number of significant
datasets, average correlation, and the number of cancers supporting this
significant correlation.
On the Gene Search page, users can search for a specific gene to explore its correlation with cell states. Simply enter the gene symbol (e.g., MKI67) in the search box.
-
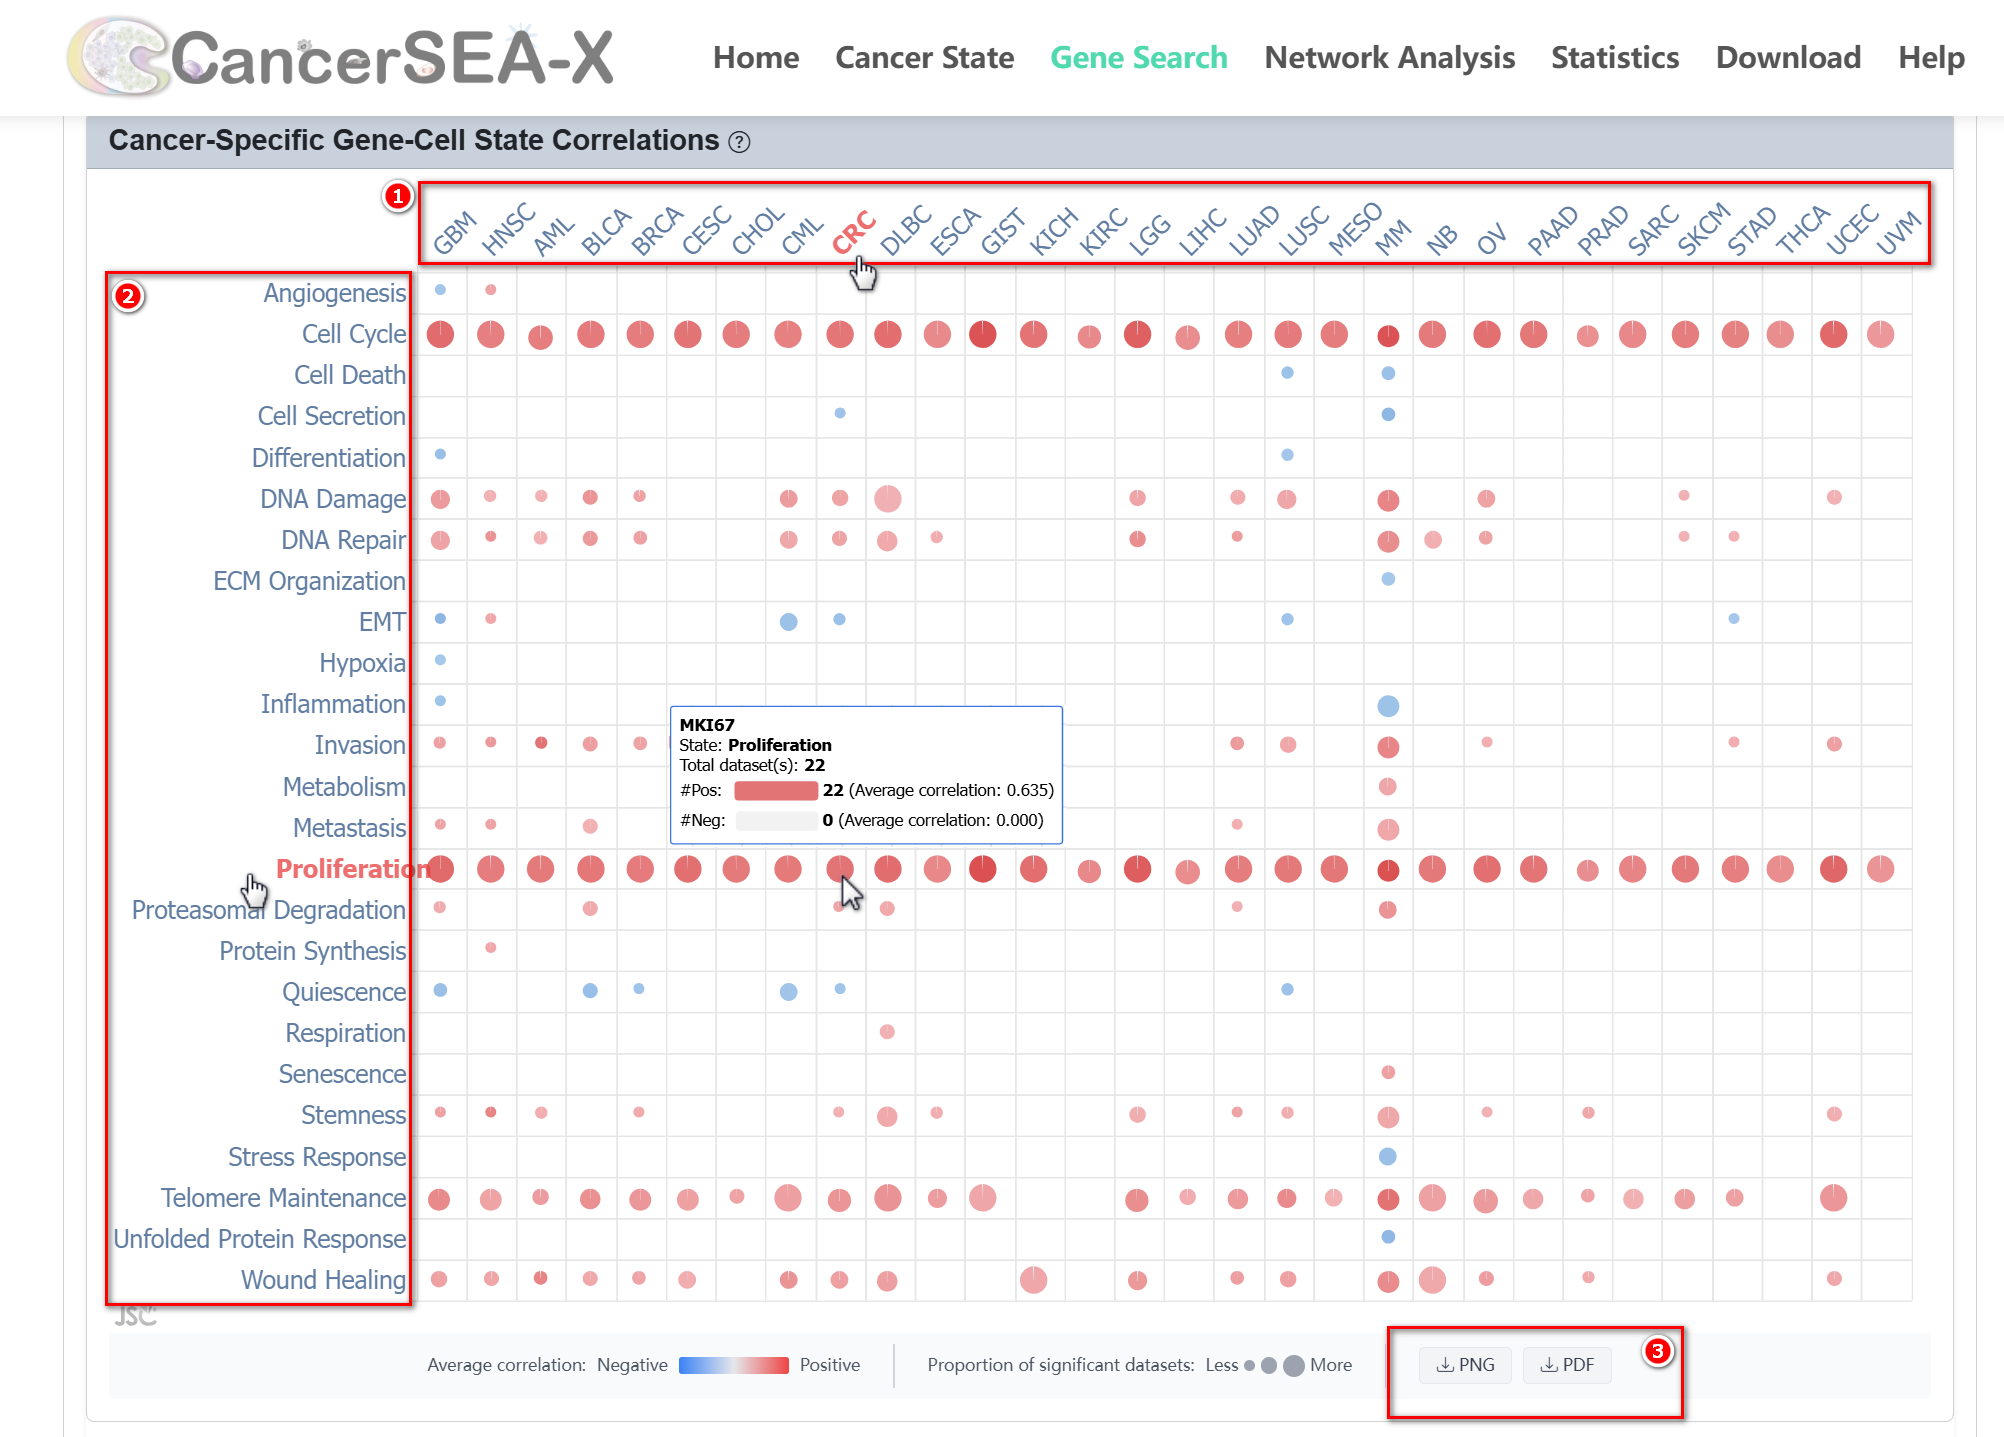
(1) Interactive gene-cell state correlations overview: By clicking the tab
for 'Cancer cell state correlation', 'Immune cell state correlation', or 'stromal
cell state correlation', users can get an overview of the average correlations
between gene expression and the activity of each cell state within the category
across all significant datasets (Pearson |r| > 0.3, FDR < 0.05) for each cancer type
through the Interactive Correlation Bubble Chart. The bubble size indicates the
proportion of significant datasets supporting the gene-state correlation within
a specific cancer type. Embedded within the bubble chart, the pie chart shows
the proportion of datasets supporting positive and negative correlations for
each cancer type, while the color intensity reflects the average correlation
strength. Hovering over the bubbles will display detailed numerical information.
-
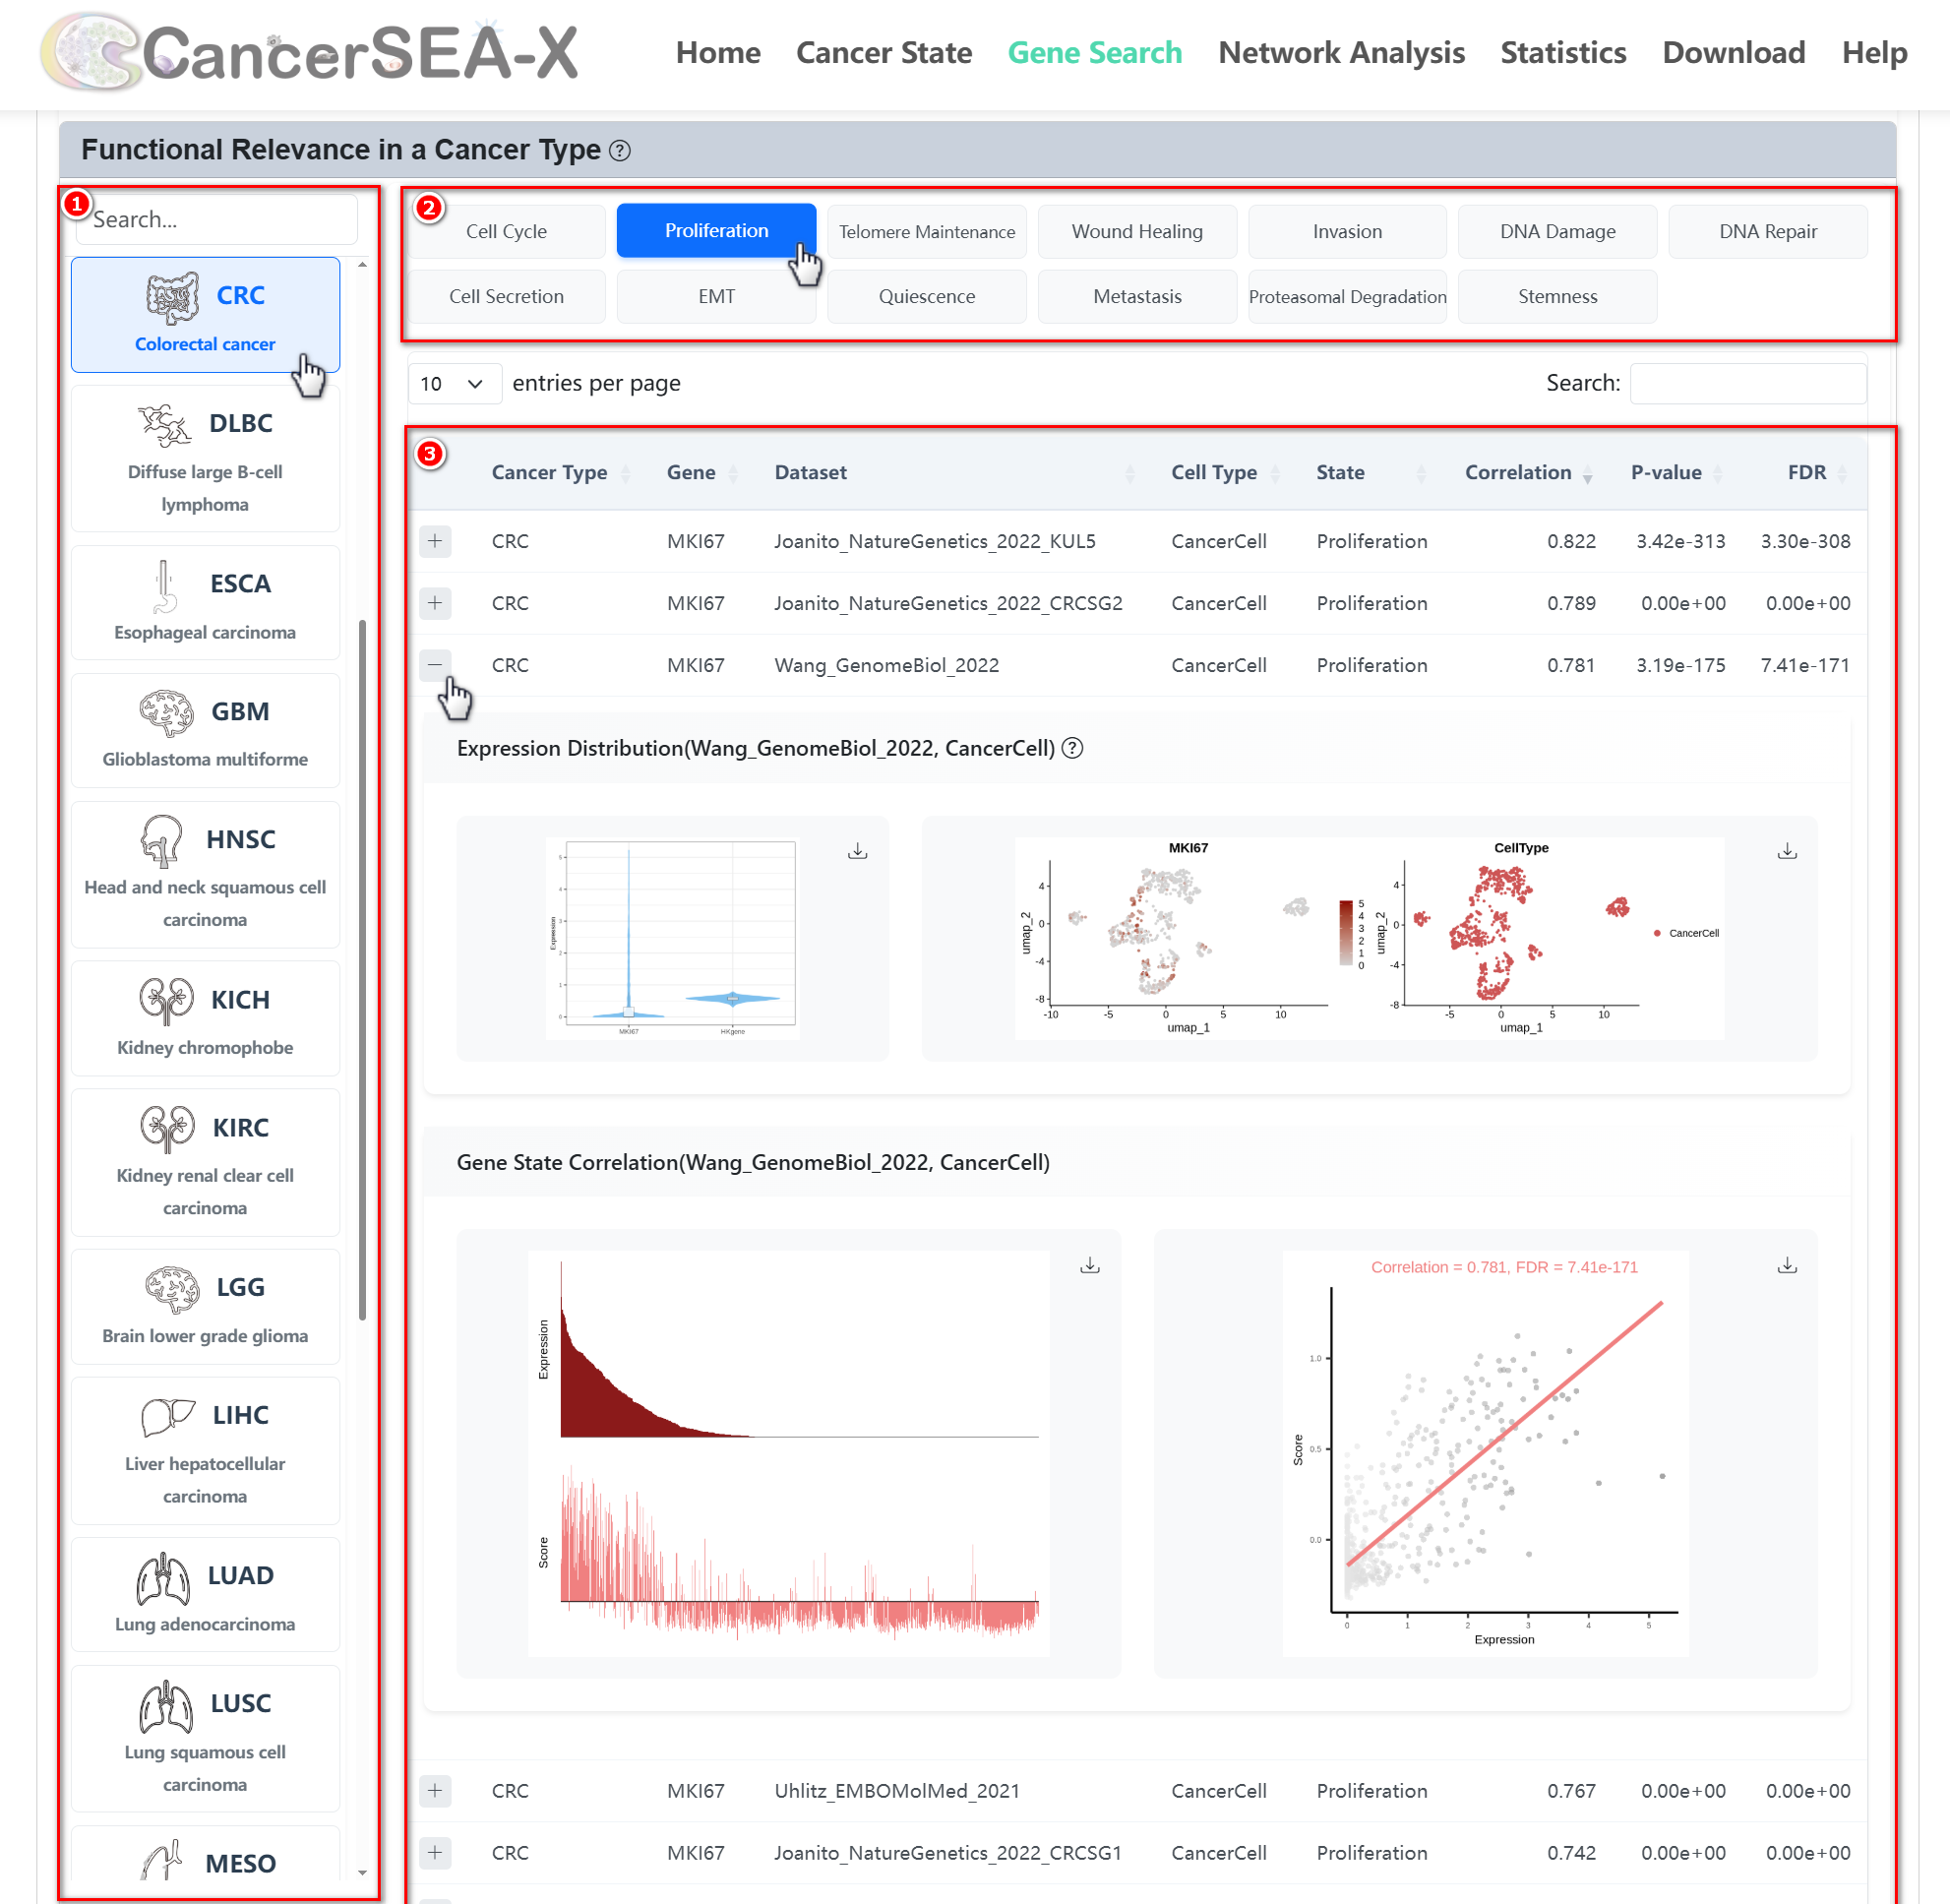
(2) Functional relevance in a cancer type:
- Users can click on the cancer type and cell state names in the Bubble Chart or select a cancer type from the browsing box below, then explore different cell states by clicking the corresponding cell state on the right.
- After selecting a gene, cancer type, and cell state, users can view detailed correlation information across relevant datasets. Clicking the "+" symbol next to each entry will expand and display the corresponding information, including the gene's Expression Distribution, Gene Expression values, Cell State activity scores, and the Gene-State Correlation scatter plot.
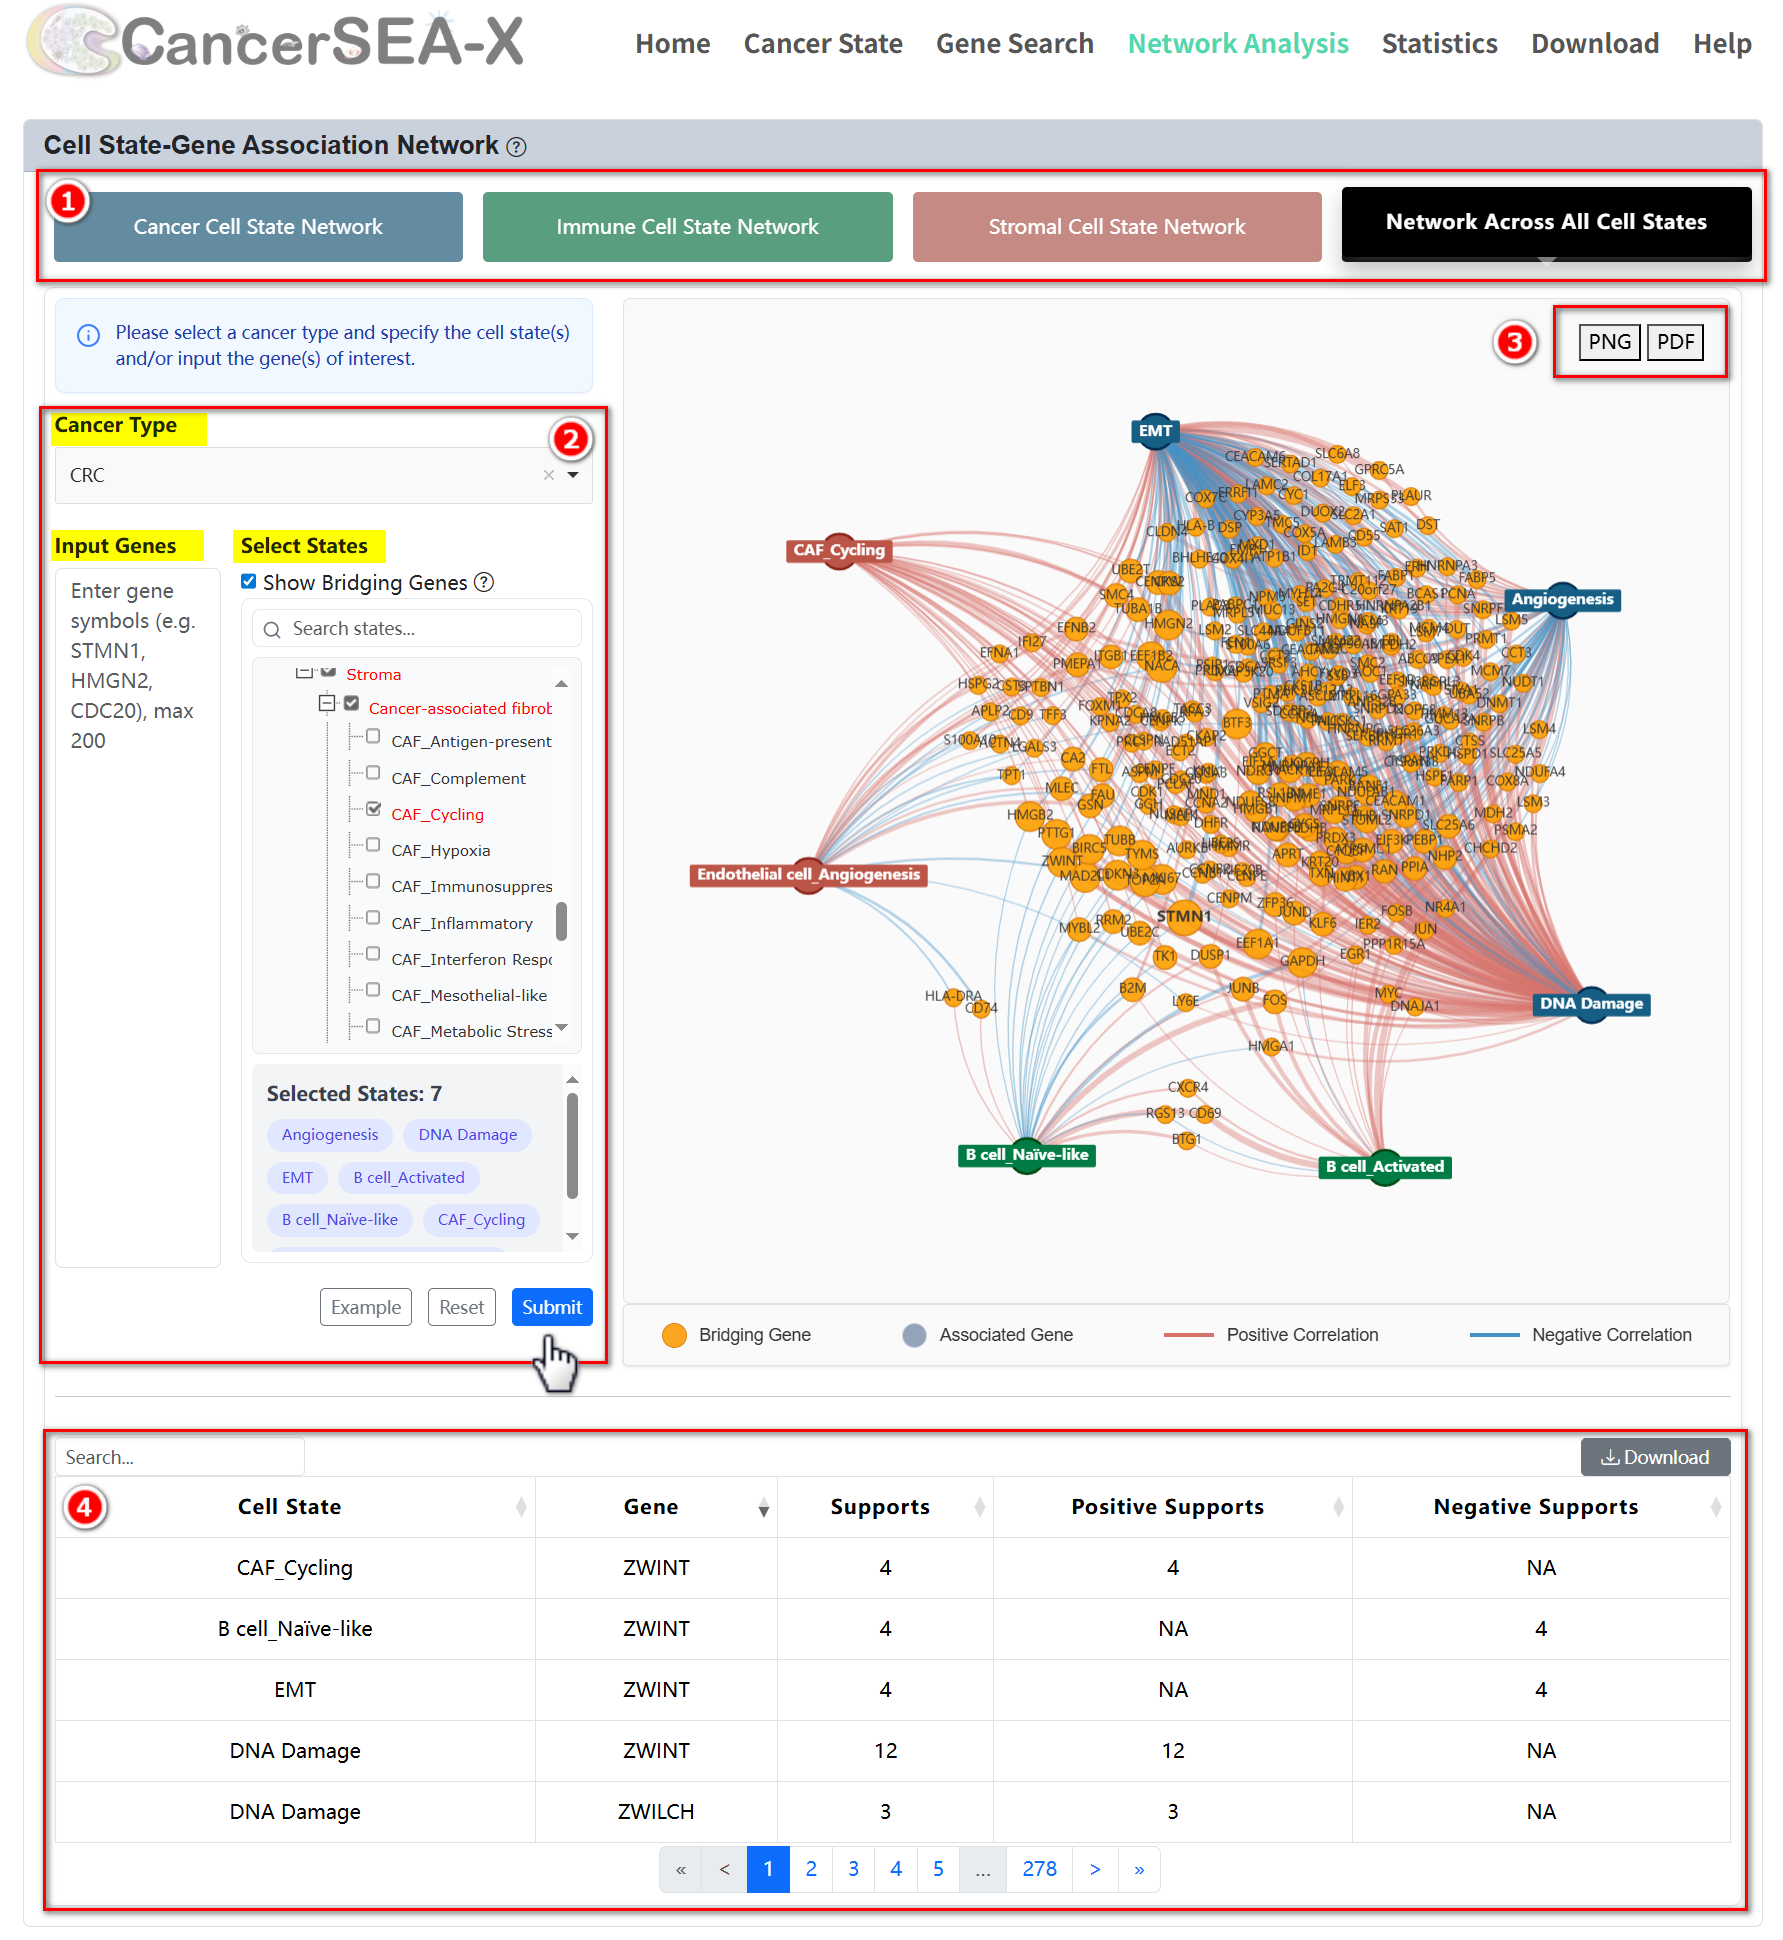
This module provides high-confidence association networks between cell states and genes across different cancer types, encompassing interactions within cancer, immune, stromal, and overall cell states. Users can select the desired type of cell state, choose a specific cancer type, and pick particular cell states to obtain the association network of interest. Additionally, users can input genes of interest to filter cell states associated with these genes and retrieve the corresponding subnetwork.
Getting Started:
Customize the settings in the selection box to explore the network:
- Select Cell State Type: Choose from Cancer, Immune, Stromal, or All.
- Select a Cancer Type: Pick the specific cancer type you're interested in.
- Specify Cell State(s): Select the cell state(s) you want to analyze.
- Input Gene(s) (Optional): Enter gene(s) of interest to refine your search.
Once you've made your selections, click the Submit button to generate the subnetwork. The results will include:
- A visualization of the selected subnetwork.
- A table below listing detailed information about nodes and edges.
In the association network, nodes represent cell states (assigned distinct colors based on their types) and genes (depicted in gray). The color of the edges indicates whether the correlation is positive (red) or negative (blue), while the thickness of the edges reflects the strength of the association between cell states and genes, with thicker edges representing stronger relationships. Within the network view, users can drag a node with the mouse and use "mouse wheel rolling" operation to zoom in/out.
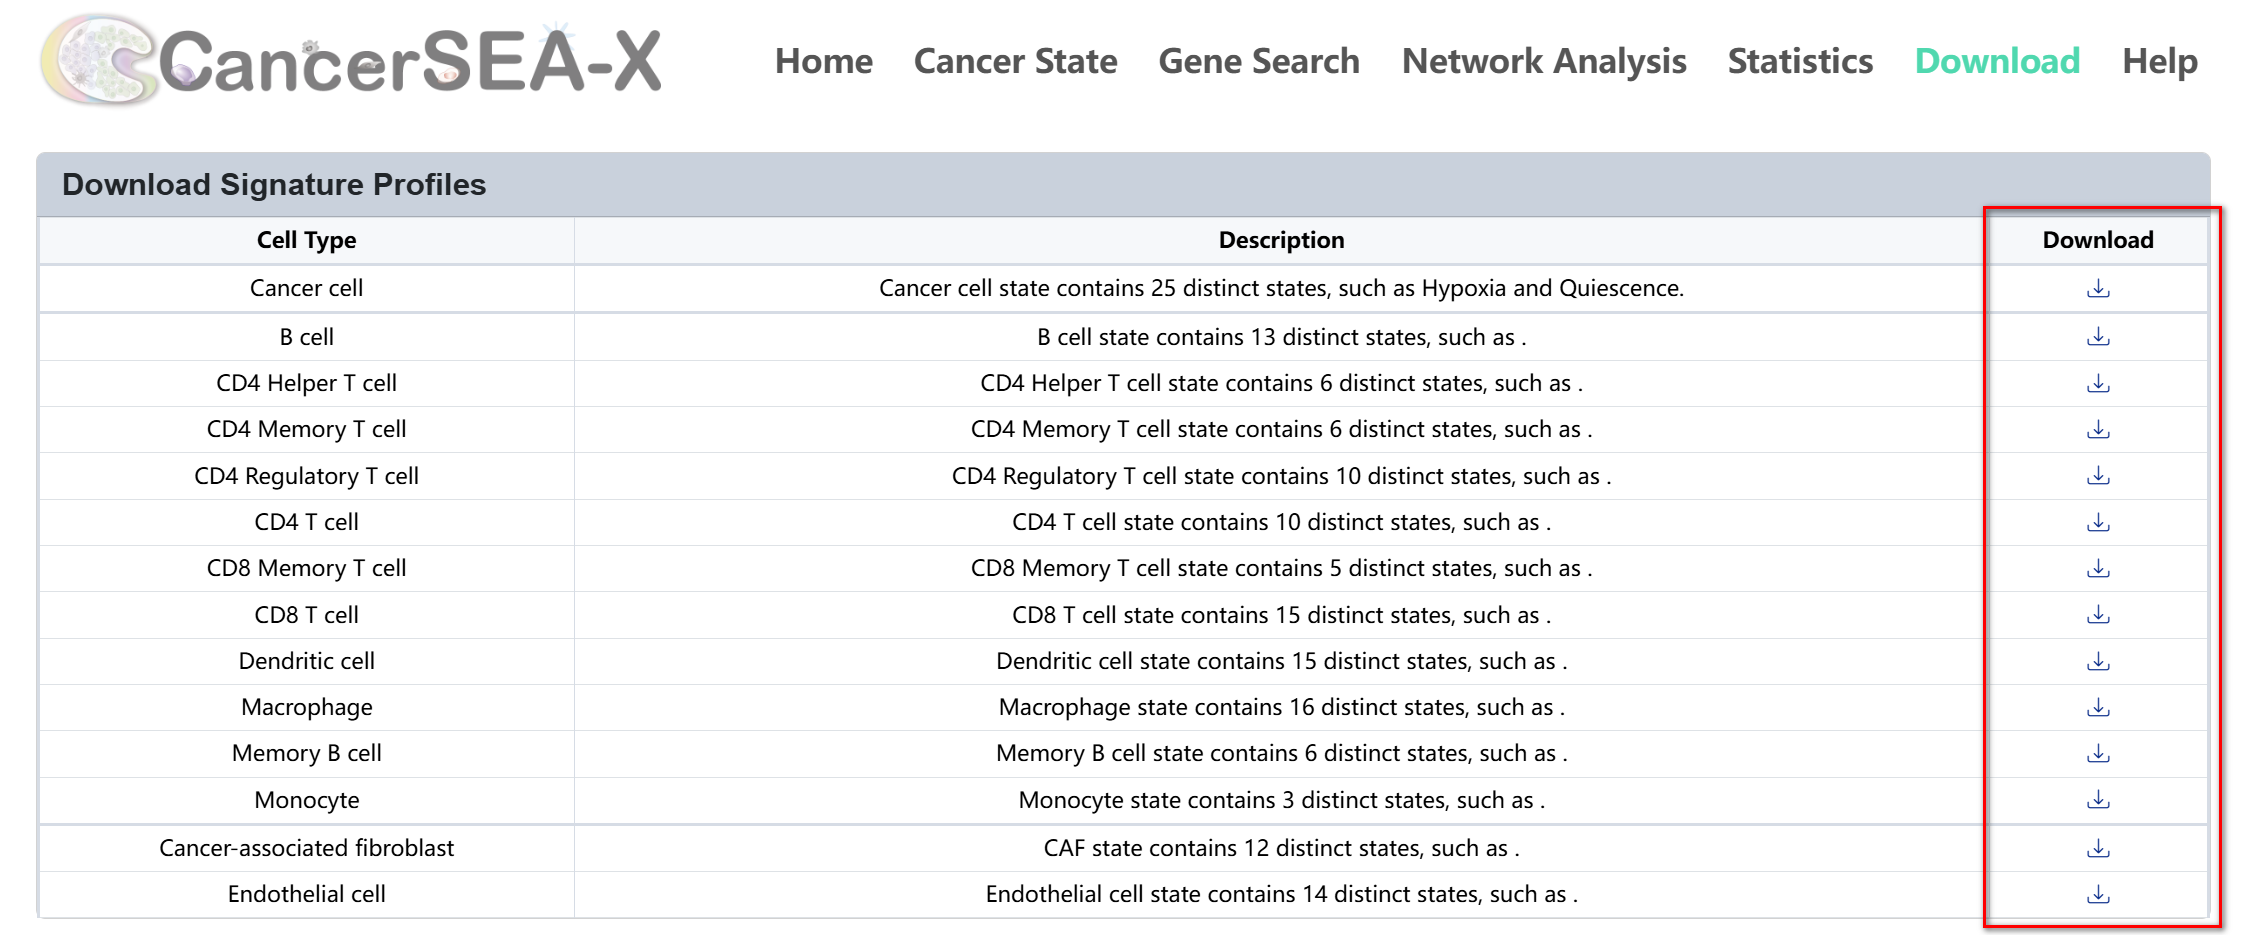
The Download section of CancerSEA-X provides access to essential datasets related to cell states across various cancer types. Users can download signature genes and state score profiles for different cell types, allowing in-depth analysis of cellular heterogeneity and functional states.
-
(1) Download signature profiles:
This section allows users to download predefined signature profiles for various cell types. Each row represents a cell type, with a description detailing the number of states and genes available. To download signature genes of each state, just click the download icon in the corresponding row to download the signature profiles (.tsv).
-
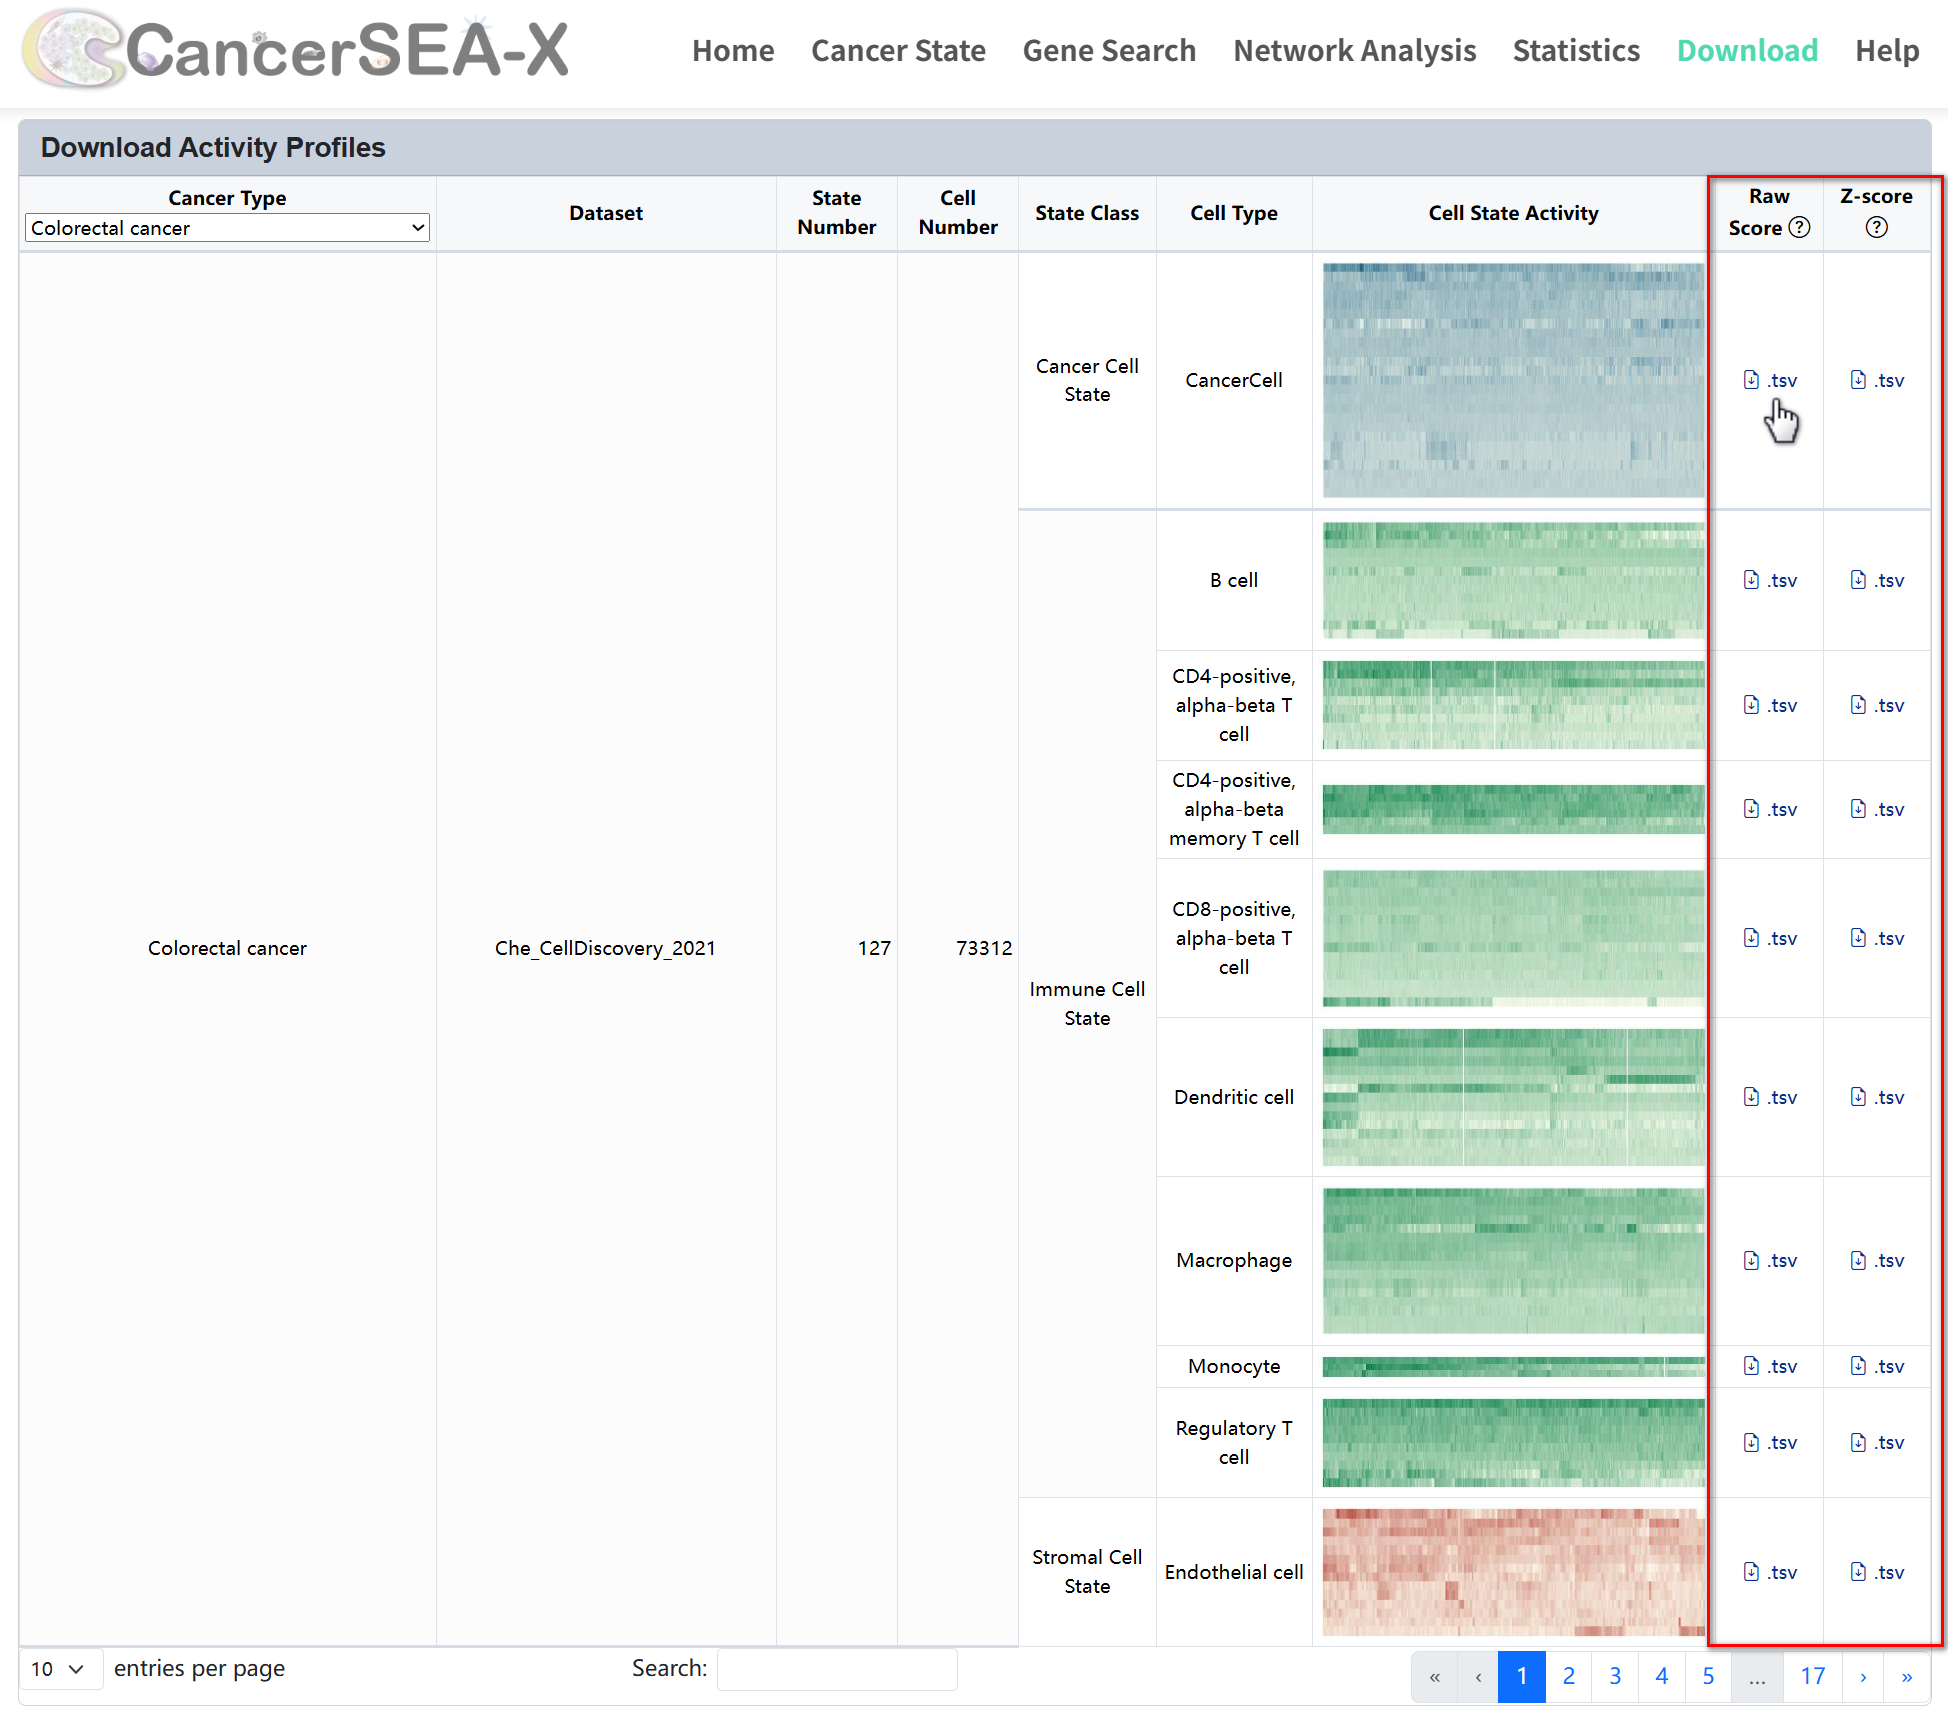
(2) Download State Score profiles:
The State Score section allows users to download datasets that quantify cell state activities across different cancer types. To download cell state activity scores, first select a cancer type from the dropdown menu or search for datasets using the search box at the bottom, then click the download icon next to the data entry to download the corresponding activity scores (.tsv). By right-clicking and selecting "Save Image As" from the context menu, users can also save and download the corresponding state score files (.jpg).